
Interactive (infographic) content is highly compelling because they combine visual elements with motion and entice user interaction which creates a memorable experience for your WordPress website visitors.
Website visitors are better able to retain information when they interact with it, making this one of your top website development priorities in the year 2020.
Creating infographics is not a daunting task and there are a lot of tools you can use, albeit adding interactiveness to them with animation, motion, popup and clickable elements is supported only by a smaller number of highly-developed tools.
Admittedly, creating an interactive infographic requires more effort, time, and design skills than a static piece, but the level of interest you can generate with this approach is well worth the added investment.
How to create an interactive infographic step by step
The process of creating your interactive infographic depends on the amount of content you can prepare yourself, and the tools you will be using to make it into an interactive piece of content.
General steps to creating an infographic are to:
- Prepare the topic and necessary information
- Sketch the storyline and interactive parts
- Create element images (bitmap or vector) with a software tool of your choice
- Animate interactive elements, again, with a software tool of your choice (WordPress plugin or other 3rd party software)
- Test the interactive infographic with an HTML browser, and upload to your WordPress website
Each of these steps needs additional elaboration, which I will do, and also add some personal notes and tips.
Prepare the topic and necessary information
Depending on the topic which you want to portray in the infographic, it’s important to prepare carefully to make sure you have enough information to support an infographic.
You can make nearly any infographic into an interactive one, but keep in mind that you are making it for an average internet user, meaning it should give a clear and understandable statement, while not being overwhelming.
The data you wish to display should be reliable and plausible, and if you’re using internal data or research provided to you by another organization, make sure you have proper permissions before including it in your piece.
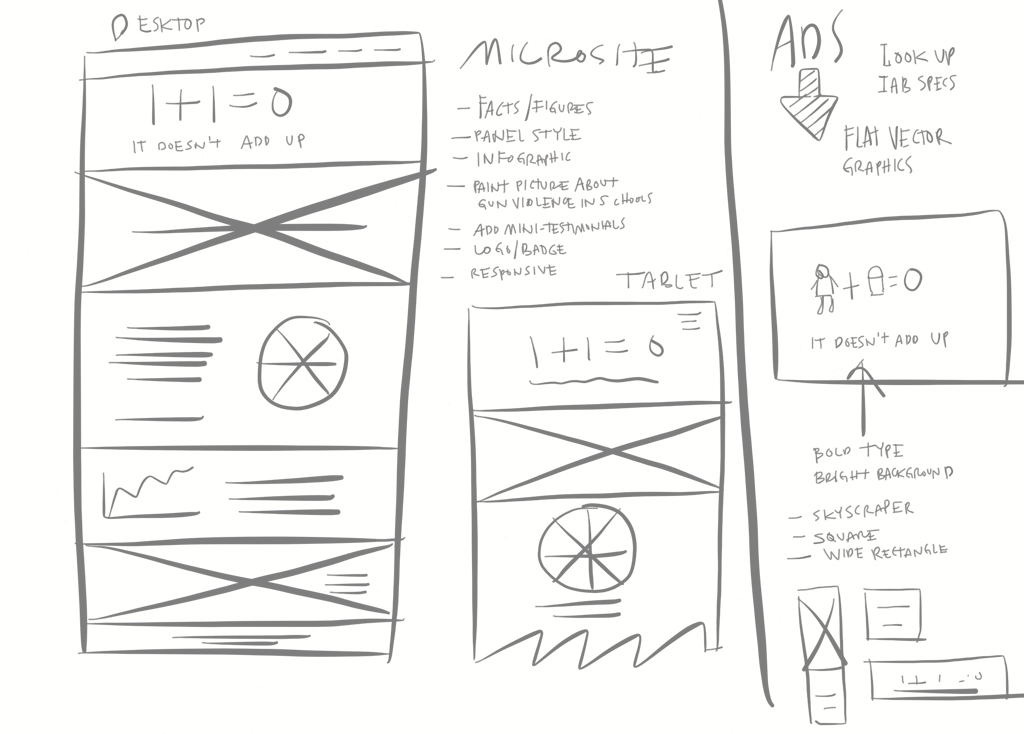
Sketch the storyline for interactive infographic parts
Before you actually start making it, sketch-out a quick storyline which you can use as a reference for static and moving or animated objects. The viewer should take an active role in helping the infographic progress from one stage to the next.
Map-out a broad overview and imagine the user clicking through to get to the inner details that support your overall message. Define your story so you can proceed to the next stage where you are bringing it to life.
Effects such as scrolling or pages unfolding provide the content consumer with a sense of discovery and engage them to continue further to complete the journey.
Clickable content incorporates a user-directed tool that brings up different sets of data when the users click or scrolls over elements, which provides a sense of control what’s displayed while they can focus on the areas that interest them most.
Create element images (bitmap or vector) with a software tool of your choice
Basic elements for an interactive infographic are made much the same as for a static piece, with your favorite bitmap or vector editor (Illustrator, Photoshop, CorelDraw …).
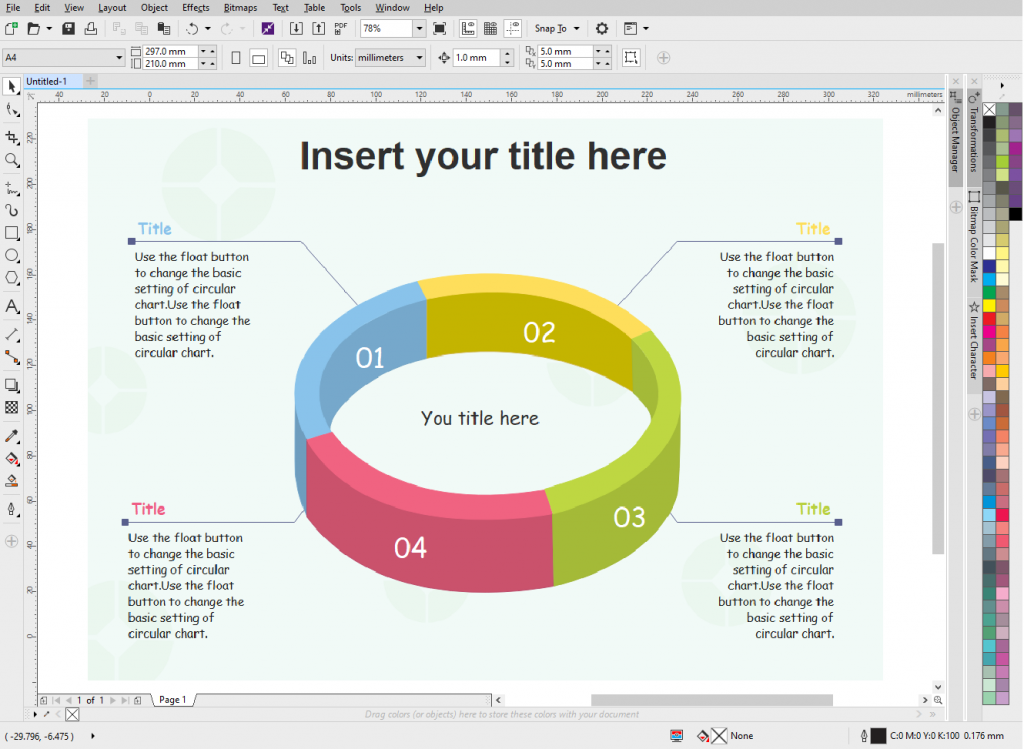
First, you will make the whole composition, and later extract each element with a transparent background for easy importing into your final piece. Carefully consider each moving element and place it on a separate layer.
Each separate piece should be exported into a file format that supports object background transparency for better compositing in the final piece, meaning you will either use PNG (bitmap) or SVG (vector) files.
Animate interactive infographic elements
Now, this is the part of the process where workflow changes depending on your choice for creating the actual interactiveness.
Those of us that are coding-savvy can use straight scripting to bring the content to life, while a more comfortable solution would be a desktop software such as Adobe Edge Animate or Ceros.
Coding with Javascript is a very good choice as simple commands can be utilized for mouse-over and click events to show and hide interactive elements. While being relatively straight-forward with basic coding it can provide very satisfactory results.
Another similar option is using CSS to add interactiveness to an SVG file – by adding interactive coding to layers of the initial file that will happen with a certain user action.

However, I am sure the majority of designers will choose a professional tool such as Adobe Animate because it provides excellent control over content with minimal coding, and it integrates very well with Illustrator, Photoshop and other graphic design software.
All that needs to be done is import background and on top of it the foreground elements, and create widgets for specific animation states and/or timeline triggers, rollover states, etc.
Ceros is another software platform that will enable you to build engaging website content with animated and/or interactive elements. Bear in mind it is a cloud-based platform that will require you to purchase it before use, but you can request a demo account.
One of the reasons why I wanted to mention Ceros is the cost of the annual subscription which is around $36.000 (yes that is thirty-six thousand dollars) for unlimited content creation, real-time collaboration, and unlimited embed codes.
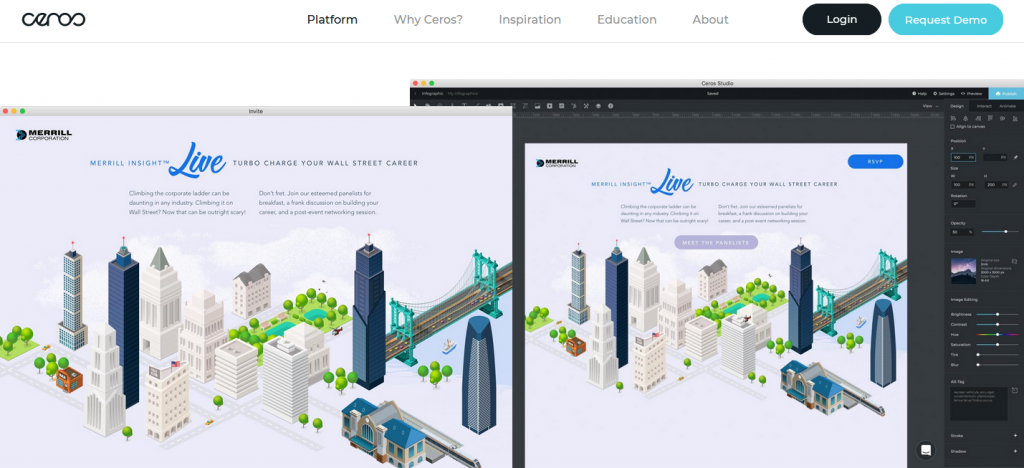
I guess for small and medium businesses this price looks exorbitant, albeit the price you would need to pay to have access to a very intuitive and fast workflow with unlimited interactive content creation may not be that high considering what they offer.
Other tools that are simple and effective at creating interactive infographics and content
It is understandable that not just professional designers are the ones who may need an infographic albeit interactive or animated, and using coding or elaborate tools can be overwhelming, but here are a few more alternatives.
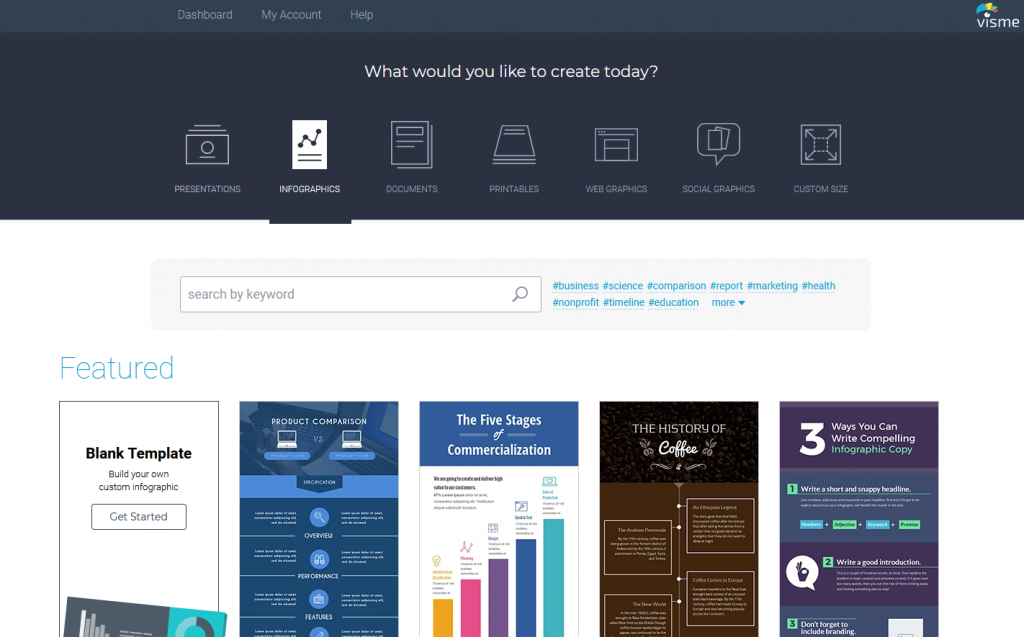
Visme is one of the alternate, very easy-to-use, drag and drop tools with a huge database of completely editable templates and assets, and the good news is that it also has a trial-mode where you can create a publicly visible animated infographic.
The downside is that it is not really cheap, and it involves a recurring subscription fee which may not be appealing to everyone.
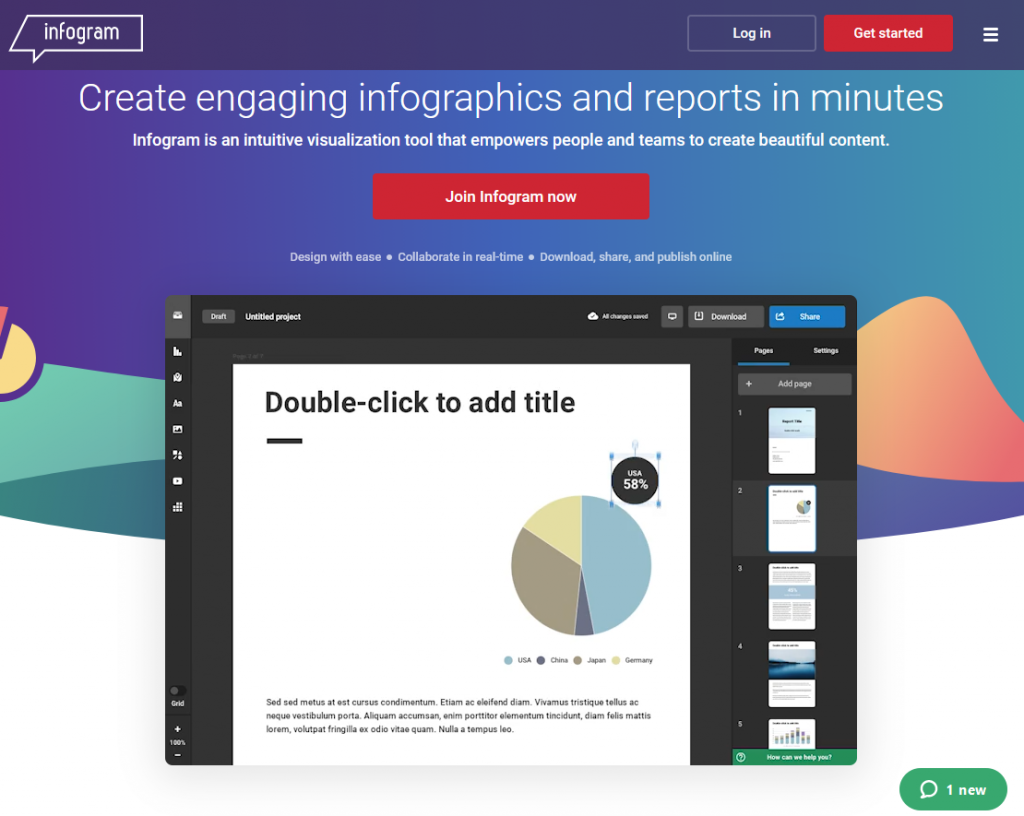
Infogram is another tool, very similar to previously mentioned one, with support for interactive web content (dashboards, reports, infographics, social media visual elements … etc.). Note that Infogram is also available as a WordPress plugin which makes it easy to embed into your website.
WordPress plugins that are categorized as interactive
Talking about WordPress plugins that can provide some kind of interactive content, we can mention Playbuzz and Apester which can be used to add quizzes, polls, stories … etc. though because this is a new trend there are not many of them.
Conclusion
Online solutions for creating interactive content such as Ceros, Visme, and Infogram are very easy to add to your page, with only an embed code, while coding and working with desktop software will require more skill or help of a developer.
Because adding animated content is still a new trend and comprehensive solutions are relatively pricey, I would expect more affordable WordPress plugins that are a tad bit less elaborate and significantly less expensive to become available sooner rather than later.